
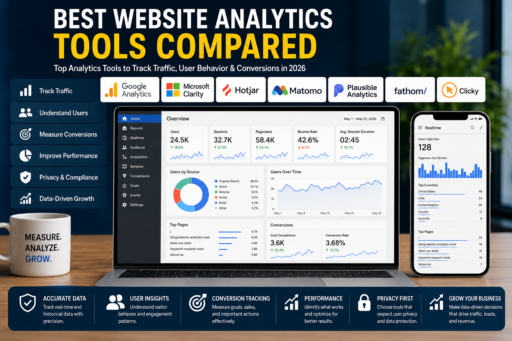
A website analytics tools comparison can help you choose the right platform for tracking traffic, understanding visitor behavior, measuring conversions, and improving website performance. With options such as Google Analytics 4, Microsoft Clarity, Hotjar, Matomo, and Plausible offering very different features, choosing the right analytics tool can be surprisingly difficult.
Google Analytics 4 provides detailed traffic and conversion reporting, Microsoft Clarity helps visualize visitor behavior, and privacy-focused platforms such as Matomo and Plausible take a different approach to analytics and data collection.
This website analytics tools comparison examines seven popular options in 2026 and, more importantly, explains which type of website each tool is best suited for.
Instead of choosing an analytics platform based on the longest feature list, start with one question: What do you actually need to learn about your visitors?
If you want detailed acquisition and conversion reporting, your ideal tool may be different from someone who wants heatmaps, session recordings, simple traffic reports, or greater control over visitor data.
Best Website Analytics Tools Compared: Quick Answer
For most website owners, Google Analytics 4 is one of the strongest overall analytics platforms because of its detailed reporting, event-based measurement, integrations, and free standard version. However, it is not necessarily the best tool for every job.
Microsoft Clarity is an excellent free choice for heatmaps and session recordings. Hotjar is better suited to teams that want deeper behavioral research and visitor feedback. Matomo stands out when data ownership and privacy controls are priorities, while Plausible Analytics and Fathom Analytics appeal to website owners who want simpler, privacy-focused analytics.
For many blogs and small websites, the most useful setup is not one tool at all. A combination such as GA4 + Microsoft Clarity can provide both quantitative traffic data and visual behavioral insights.
Website Analytics Tools Comparison Table
| Tool | Best For | Free Option | Heatmaps | Session Recordings | Privacy Focus | Ease of Use |
|---|---|---|---|---|---|---|
| Google Analytics 4 | Overall website and marketing analytics | Yes | No | No | Moderate | Moderate |
| Microsoft Clarity | Free behavior analytics | Yes | Yes | Yes | Moderate | Easy |
| Hotjar | UX research and visitor behavior | Limited/free options may apply | Yes | Yes | Moderate | Easy |
| Matomo | Privacy and data ownership | Self-hosted option | Available depending on setup | Available depending on setup | High | Moderate |
| Plausible Analytics | Simple privacy-focused analytics | No permanent free cloud plan | No | No | High | Very Easy |
| Clicky | Real-time website monitoring | Limited option | Plan dependent | No | Moderate | Easy |
| Fathom Analytics | Simple privacy-first reporting | Trial rather than permanent free plan | No | No | High | Very Easy |
Features and pricing can change. Always confirm current plan details on the provider’s official website before choosing a platform.
Our Top Picks by Use Case
There is no single analytics platform that wins every category. Based on the capabilities these platforms provide, these are the most practical choices for common website needs:
- Best overall: Google Analytics 4
- Best free behavior analytics: Microsoft Clarity
- Best for heatmaps and UX research: Hotjar
- Best for data ownership: Matomo
- Best for simple privacy-focused reporting: Plausible Analytics
- Best for real-time monitoring: Clicky
- Best minimalist privacy-first alternative: Fathom Analytics
The right choice still depends on your website. A content publisher may care primarily about traffic sources and top-performing pages, while an eCommerce business may care much more about events, funnels, conversions, and user friction.
How We Compared These Website Analytics Tools
This website analytics tools comparison focuses on practical differences that matter when choosing a platform for a real website.
This comparison focuses on practical differences that matter when running a real website rather than simply counting how many features each platform advertises.
We evaluated the tools across several areas:
- Traffic and acquisition reporting
- Event and conversion measurement
- Real-time reporting
- Heatmaps and session recordings
- Ease of installation and daily use
- Privacy and data-control options
- Integrations
- Suitability for blogs, small businesses, and larger websites
- Availability of free or lower-cost entry options
It is also important to distinguish between traditional web analytics and behavior analytics.
GA4 is primarily designed to measure events, traffic, acquisition, engagement, and conversions. Clarity and Hotjar can visually reveal where visitors click, scroll, hesitate, or encounter friction.
That distinction explains why two analytics tools can sometimes work better together than either one does alone.
1. Google Analytics 4 (GA4) — Best Overall
Google Analytics 4 remains one of the most capable starting points for website owners who need detailed information about traffic, acquisition, engagement, events, and conversions.
Unlike older pageview-centered analytics models, GA4 uses an event-based measurement system. Events can include automatically collected interactions as well as enhanced measurement events, recommended events, and custom events configured for a website’s specific needs.
This makes GA4 useful for much more than counting visitors. A properly configured property can measure actions such as sign-ups, purchases, downloads, clicks, and other meaningful interactions.
Key GA4 Features
- Event-based website and app measurement
- Traffic acquisition reporting
- Engagement reporting
- Conversion and key-event measurement
- Audience creation and segmentation
- Cross-platform measurement
- Integration with other Google marketing products
- Custom events for site-specific actions
Why GA4 Stands Out
The biggest advantage of GA4 is the depth of information available without requiring a paid analytics subscription for a typical website.
It can answer questions such as:
- Which channels bring visitors to the website?
- Which landing pages attract organic traffic?
- What actions do visitors take after arriving?
- Which campaigns generate conversions?
- How do different audience segments behave?
That makes GA4 particularly useful for marketers, publishers, eCommerce websites, and businesses that need to connect traffic with measurable outcomes.
Where GA4 Falls Short
Its greatest strength is also one of its weaknesses: GA4 can feel complicated.
A beginner who simply wants to know which pages are popular may find the interface and terminology more difficult than a lightweight analytics dashboard. Some useful measurements also require configuration rather than appearing exactly as a new user expects.
GA4 also does not replace dedicated behavior-analytics tools. If you want to visually see where visitors click or review session replays, a tool such as Microsoft Clarity serves a different purpose.
GA4 Pros
- Powerful analytics without a typical paid subscription
- Detailed acquisition and engagement reports
- Flexible event measurement
- Strong ecosystem and integrations
- Suitable for websites that expect to grow
GA4 Cons
- Steeper learning curve than simpler analytics products
- Can be overwhelming for beginners
- Does not provide native heatmaps or session recordings
- Good measurement often requires thoughtful configuration
Who Should Choose GA4?
Choose GA4 if you want a comprehensive analytics foundation and expect to measure more than basic visitor counts.
It is especially useful when acquisition channels, campaigns, events, or conversions matter to your business.
If you only want a clean dashboard showing visitors, pages, and referral sources, a simpler platform may be easier to use.
2. Microsoft Clarity — Best Free Behavior Analytics Tool
Microsoft Clarity solves a different problem from GA4.
Instead of concentrating primarily on reports and traffic metrics, it helps website owners understand what visitors actually do on individual pages.
Its most recognizable features are session recordings and heatmaps. Click heatmaps reveal which elements attract interaction, while scroll heatmaps can show how far visitors move down a page.
Session recordings provide another perspective by allowing site owners to review user journeys and identify potential friction.
Clarity has also expanded beyond those original features, adding AI-assisted capabilities designed to make patterns in behavior data easier to identify.
Key Microsoft Clarity Features
- Session recordings
- Click and scroll heatmaps
- Area and attention insights
- Rage-click and dead-click signals
- Rich filtering and segmentation
- AI-powered summaries and insights
- Smart Events
- Integration with Google Analytics
Why Clarity Is Particularly Useful for Bloggers
Traditional analytics may tell you that a page has poor engagement. Clarity can help investigate why.
For example, a publisher could examine whether visitors:
- Leave before reaching an important section
- Repeatedly click an element that is not actually clickable
- Ignore a call-to-action
- Stop scrolling before reaching a comparison table
- Encounter a confusing page element
That type of information can make content and design improvements much more specific.
Clarity Pros
- Free access to its core analytics capabilities
- Heatmaps and session recordings
- Easy to understand visually
- Useful frustration signals
- Can complement GA4 instead of replacing it
- AI-assisted capabilities can reduce manual analysis
Clarity Cons
- Not a complete replacement for detailed acquisition analytics
- Watching recordings without a clear question can waste time
- Behavioral data still needs interpretation before making site changes
Who Should Choose Microsoft Clarity?
Clarity is particularly valuable for bloggers, landing pages, content websites, eCommerce stores, and small businesses that want to understand visitor behavior without adding another major analytics subscription.
For many website owners, however, the better question is not GA4 or Clarity?
It is GA4 and Clarity?
GA4 can show what happened at an aggregate level, while Clarity can provide visual context around how visitors interacted with a page.
3. Hotjar — Best for UX Research and Visitor Feedback
Hotjar became popular by making behavioral analytics accessible to teams that wanted more than traditional traffic reports.
Its focus is understanding the user experience through tools such as heatmaps, recordings, surveys, and feedback.
This makes Hotjar particularly relevant when the problem is not simply measuring how many people reached a page, but understanding where users become confused, what they notice, and what they say about the experience.
Key Hotjar Strengths
- Heatmaps
- Session recordings
- Surveys and user feedback
- Behavior analysis
- UX research workflows
Hotjar vs Microsoft Clarity
Clarity is extremely attractive when the priority is obtaining heatmaps and session recordings at no cost.
Hotjar becomes more interesting when a team also wants structured feedback and research capabilities around the behavioral data.
For a small blog, Clarity may therefore provide everything necessary. For a product team actively researching why users abandon a process or how customers feel about an experience, Hotjar’s broader research approach can be more relevant.
Hotjar Pros
- Strong behavioral analysis
- Combines visual behavior with direct user feedback
- Useful for conversion and UX research
- Accessible interface for non-technical teams
Hotjar Cons
- May be more than a basic content website needs
- Advanced requirements can involve paid plans
- It does not replace a complete acquisition platform such as GA4
Who Should Choose Hotjar?
Hotjar makes the most sense for businesses, product teams, and conversion-focused websites that want to combine observed visitor behavior with direct feedback.
A publisher whose main goal is simply understanding traffic sources may get more immediate value from GA4. A publisher specifically trying to diagnose why visitors abandon pages may benefit much more from a behavior analytics tool.
4. Matomo — Best for Data Ownership and Control
Matomo is one of the most established alternatives for organizations that want greater control over their analytics environment and visitor data.
One of its biggest differentiators is deployment flexibility. Matomo can be used in ways that give organizations substantially more control over where analytics data is stored and how the analytics stack is managed.
This makes it especially relevant for organizations where privacy requirements, data governance, or ownership are central to the analytics decision.
Key Matomo Features
- Website traffic analytics
- Visitor and acquisition reporting
- Goal and conversion measurement
- Customizable reporting
- Self-hosting options
- Strong emphasis on data control
- Additional behavior and optimization capabilities depending on configuration and plan
Matomo Pros
- Greater control over analytics data
- Strong privacy positioning
- Flexible deployment options
- Detailed analytics capabilities
- Viable alternative for organizations moving away from Google-centric analytics
Matomo Cons
- Self-hosting introduces additional technical responsibility
- More setup and maintenance may be required
- Can be unnecessary complexity for a very small blog
Who Should Choose Matomo?
Matomo deserves serious consideration when ownership, privacy, hosting flexibility, and control are more important than having the simplest possible analytics setup.
For a beginner running a small personal blog, GA4 or a lightweight analytics service may be easier. For an organization with stricter data requirements, Matomo’s additional control can be a major advantage.
5. Plausible Analytics — Best for Simple Privacy-Focused Analytics
Plausible Analytics takes almost the opposite approach from complex enterprise-style analytics platforms.
Instead of presenting users with a huge collection of reports and configuration options, it focuses on a cleaner and more understandable view of website performance.
This simplicity is one of its main attractions. Many website owners do not need hundreds of dimensions and reports.
They want to understand traffic, popular pages, referral sources, campaigns, and important goals without spending hours learning an analytics interface.
Why Plausible Appeals to Independent Website Owners
A lightweight analytics product can be particularly useful when analytics is something you want to use, not something you want to spend significant time configuring.
Plausible is therefore appealing to bloggers, independent publishers, SaaS businesses, and small teams that value simplicity and privacy.
Plausible Pros
- Clean and focused dashboard
- Privacy-focused design
- Easy for beginners to understand
- Lightweight approach
- Useful core traffic and goal reporting
Plausible Cons
- Less reporting depth than GA4 for complex marketing analysis
- Cloud service requires a paid subscription after any applicable trial
- No native session recordings or heatmaps
Who Should Choose Plausible?
Choose Plausible if you want analytics to remain simple and privacy-focused and you do not need the depth of a platform such as GA4.
If detailed advertising attribution, complex audience segmentation, or extensive event analysis is central to your strategy, GA4 or another more advanced platform may be a better fit.
6. Clicky — Best for Real-Time Website Monitoring
Clicky has been around for many years, but its straightforward approach to real-time website analytics continues to make it relevant for website owners who want to see visitor activity without navigating a highly complex reporting system.
Its strongest appeal is immediacy. Instead of focusing only on aggregated reports, Clicky makes it easy to monitor what is happening on a website as visitors arrive and interact with pages.
Key Clicky Features
- Real-time visitor analytics
- Traffic source reporting
- Individual visitor and action data
- Goal tracking
- Campaign tracking
- Engagement and page analytics
- Additional monitoring features depending on the selected plan
Clicky Pros
- Strong real-time reporting
- Relatively straightforward interface
- Useful for monitoring immediate traffic activity
- Good alternative for users who find larger analytics platforms overwhelming
Clicky Cons
- Smaller ecosystem than Google Analytics
- Not the strongest choice for sophisticated marketing attribution
- Some capabilities depend on the selected plan
Who Should Choose Clicky?
Clicky is worth considering if real-time monitoring is one of your highest priorities and you prefer a more direct analytics experience.
However, websites that rely heavily on advertising platforms, detailed campaign attribution, or complex event measurement may find GA4 more suitable as their primary analytics platform.
7. Fathom Analytics — Best Minimalist Privacy-First Alternative
Fathom Analytics is another option for website owners who want useful traffic information without the complexity associated with larger analytics platforms.
Its philosophy centers on privacy, simplicity, and presenting important website metrics in a dashboard that can be understood quickly.
That approach makes Fathom particularly attractive to publishers, independent businesses, and website owners who do not need an enormous analytics ecosystem.
Key Fathom Strengths
- Simple website analytics dashboard
- Privacy-focused approach
- Traffic source reporting
- Campaign measurement
- Goal and event measurement capabilities
- Lightweight analytics approach
Fathom Pros
- Easy to understand
- Strong privacy positioning
- Minimalist interface
- Good fit for website owners who dislike analytics complexity
Fathom Cons
- Paid product after any applicable trial
- Less depth than GA4 for advanced marketing analysis
- No native heatmaps or session recordings
Who Should Choose Fathom?
Fathom is best suited to website owners who are willing to pay for a simpler, privacy-focused analytics experience.
If price is the primary consideration, free platforms such as GA4 and Microsoft Clarity will usually be more attractive. If simplicity and privacy are higher priorities, Fathom becomes much more compelling.
An effective website analytics tools comparison should also examine platforms directly because different tools often solve very different problems.
Google Analytics vs Microsoft Clarity: Which Is Better?
This is one of the most useful comparisons because GA4 and Clarity are often treated as competitors even though they solve different problems.
| Feature | Google Analytics 4 | Microsoft Clarity |
|---|---|---|
| Traffic acquisition | Excellent | Basic/behavior-focused |
| Event measurement | Excellent | Available for behavior analysis |
| Conversion analysis | Strong | Not its primary purpose |
| Heatmaps | No | Yes |
| Session recordings | No | Yes |
| Visual behavior analysis | Limited | Excellent |
| Price | Free for standard GA4 | Free |
For most bloggers and small website owners, choosing between them is unnecessary. They can complement each other.
Use GA4 to understand what happened. For example, you can identify where visitors came from, which pages they entered through, and which important events occurred.
Use Clarity to investigate how visitors behaved. Heatmaps and recordings can reveal whether people reached an important section, struggled with an interface element, or stopped scrolling earlier than expected.
This combination is particularly useful when trying to improve content performance rather than simply watching traffic numbers.
Plausible vs Matomo: Which Privacy-Focused Tool Is Better?
Plausible and Matomo are both commonly considered by website owners looking beyond mainstream analytics platforms, but they serve different types of users.
Plausible prioritizes simplicity. It is designed to make essential website statistics easier to understand without requiring users to navigate a large reporting environment.
Matomo prioritizes control and flexibility. It can support organizations that need greater control over their analytics infrastructure and data.
| Factor | Plausible | Matomo |
|---|---|---|
| Best for | Simple analytics | Control and detailed analytics |
| Learning curve | Low | Moderate |
| Privacy focus | High | High |
| Self-hosting | Available | Strong self-hosted option |
| Reporting complexity | Low | Higher |
| Best fit | Blogs and smaller teams | Organizations needing greater control |
If you want to open a dashboard and understand your core website statistics quickly, Plausible is attractive. If your requirements involve greater customization, ownership, and control, Matomo deserves closer consideration.
Which Website Analytics Tool Should You Choose?
The goal of this website analytics tools comparison is not to declare one platform perfect for everyone, but to match each tool with the right use case.
The easiest way to choose an analytics platform is to start with your primary goal instead of starting with a brand name.
If You Run a Blog or Content Website
Start with Google Analytics 4 if you want detailed traffic and acquisition reporting. Add Microsoft Clarity when you want to understand scrolling, clicking, and on-page behavior.
This combination can answer two different questions:
- Which content attracts and retains visitors?
- How do visitors actually interact with that content?
For publishers who prefer a much simpler dashboard and place greater emphasis on privacy, Plausible or Fathom may be more comfortable alternatives.
If You Run an eCommerce Website
An eCommerce business usually needs more than pageview counts. Product interactions, checkout behavior, purchases, campaigns, and other meaningful events matter.
GA4 is a strong candidate when detailed event and conversion measurement is required. A behavior analytics platform can then help investigate friction on product, cart, and landing pages.
If You Run a Small Business Website
Do not automatically choose the platform with the most features.
If the website primarily generates leads through a few key pages, concentrate on measuring the actions that matter: form submissions, calls, bookings, downloads, or other meaningful conversions.
GA4 offers substantial flexibility, while a simpler platform may be more appropriate if the business only needs essential traffic and referral information.
If Privacy and Data Control Are Your Main Priorities
Evaluate Matomo, Plausible, and Fathom carefully.
Do not assume that installing a product marketed as privacy-focused automatically makes a website compliant with every privacy law. Configuration, cookies, consent requirements, hosting choices, the data you collect, and the jurisdictions in which you operate can all matter.
If Your Budget Is $0
A combination of Google Analytics 4 and Microsoft Clarity provides a broad analytics toolkit without requiring a typical paid subscription.
GA4 provides detailed measurement and reporting, while Clarity adds heatmaps and session recordings. For many new websites, that is more than enough to begin making informed decisions.
What Website Analytics Metrics Actually Matter?
One of the easiest analytics mistakes is tracking everything simply because the platform makes the data available.
A better approach is to connect metrics to decisions.
1. Traffic Sources
Traffic-source data helps answer where visitors originate. Depending on the platform and reporting model, this can include organic search, referrals, direct visits, social platforms, email, and paid campaigns.
The useful question is not simply, “How much traffic did we receive?” It is, “Which sources bring visitors who do something valuable?”
2. Landing Pages
Landing-page reports can reveal which pages serve as entry points to your website.
For a content website, this can help identify articles attracting search traffic. For a business, it can reveal which service or campaign pages introduce potential customers to the brand.
3. Engagement
Engagement data can help identify patterns, but it should not be interpreted in isolation.
A short visit is not automatically bad. A visitor might find an answer immediately. Likewise, a long visit is not automatically good if the visitor is simply confused.
Combine quantitative engagement metrics with page context and, where appropriate, behavioral tools such as heatmaps and recordings.
4. Conversions and Important Events
These are often more valuable than raw pageviews.
A website with 5,000 visitors and 200 meaningful conversions may be performing better than one with 50,000 visitors and almost no valuable actions.
Examples include:
- Purchases
- Lead-form submissions
- Newsletter subscriptions
- Account registrations
- Downloads
- Important outbound clicks
5. Content Performance
Publishers should monitor which pages attract visitors, which sources send that traffic, and whether those visitors continue exploring the site.
Analytics becomes particularly useful when combined with search-performance data. Analytics can show what visitors do on your website, while search tools can reveal how pages perform before the click.
Website Analytics vs Google Search Console
Website analytics software and Google Search Console should not be treated as substitutes.
Search Console focuses on a website’s presence in Google Search. It can provide information such as search queries, impressions, clicks, average positions, indexing status, and other search-related signals.
Analytics tools focus primarily on activity associated with the website itself.
A simple way to think about the difference is:
- Search Console: What happened in Google Search before and around the click?
- Website analytics: What happened when people visited and interacted with the website?
Using both provides a much more useful picture than relying on either one alone.
How to Use Analytics to Improve SEO
Analytics cannot replace keyword research or Search Console, but it can reveal what happens after organic visitors arrive.
For example, suppose Search Console shows that an article receives impressions and clicks for an important search query. Analytics can then help determine whether those visitors continue to other pages or complete important actions.
A behavior tool can add another layer by showing whether visitors reach the sections you consider most valuable.
This creates a practical improvement cycle:
- Use Search Console to identify pages receiving search visibility.
- Use analytics to understand traffic and engagement.
- Use behavior data where appropriate to identify on-page friction.
- Improve the page based on evidence rather than assumptions.
- Measure the results over a meaningful period.
For additional SEO research, see our guide to Best SEO Tools for Bloggers in 2026.
You can also explore our guide to Best Keyword Research Tools for Beginners when researching future content opportunities.
Common Website Analytics Mistakes
Installing an analytics tool does not automatically lead to better decisions. The value comes from asking useful questions and acting on the answers.
Watching Traffic Every Day Without Context
Daily traffic naturally fluctuates. Small changes can create unnecessary concern when viewed without a longer comparison period.
Look for meaningful trends rather than reacting to every movement.
Focusing Only on Pageviews
More pageviews can be encouraging, but they do not explain whether visitors are accomplishing anything useful.
Pair traffic numbers with metrics related to your actual objectives.
Tracking Too Many Events
Just because an interaction can be tracked does not mean it should become a key metric.
Start with a small number of actions tied directly to business or publishing goals. Add complexity when it answers a real question.
Ignoring Analytics Configuration
Incorrect or incomplete implementation can lead to misleading conclusions.
After installing an analytics platform, verify that the important pages, events, and conversions are being measured as expected.
Using Heatmaps Without a Question
A colorful heatmap may look impressive, but it is only useful when it helps answer something specific.
For example:
- Do visitors reach the pricing table?
- Are they clicking the intended button?
- Do mobile users stop scrolling earlier than desktop users?
- Is an important element being ignored?
Start with the question, then use the data.
Assuming Analytics Explains Why Something Happened
Analytics often reveals what happened. It does not always prove why.
A traffic decline, for example, could have many causes. Avoid turning correlation into certainty without additional evidence.
Can You Use More Than One Website Analytics Tool?
Yes, and there are legitimate reasons to do so.
A common example is using GA4 for acquisition, events, and conversions while using Microsoft Clarity for heatmaps and recordings.
However, more tools are not automatically better.
Every additional script, dashboard, configuration, and data source creates more work. Choose multiple tools only when each one answers a question the others cannot answer efficiently.
Free vs Paid Website Analytics Tools
A free analytics platform is not automatically inferior to a paid one.
GA4 and Microsoft Clarity demonstrate that powerful analytics capabilities can be available without a traditional subscription fee.
Paid analytics platforms can still make sense when they offer something particularly valuable to you, such as:
- A simpler interface
- Specific privacy characteristics
- Greater data control
- Specialized UX research
- Customer support
- Features designed for a particular workflow
Think about the cost of using the product as well as the subscription price. A free tool that nobody understands may provide less practical value than a paid tool that gets used consistently.
After reviewing this website analytics tools comparison, your final choice should depend on your goals, budget, privacy requirements, and the type of data you actually need.
Frequently Asked Questions
What is the best website analytics tool in 2026?
Google Analytics 4 is one of the strongest overall choices for websites that need detailed traffic, acquisition, event, and conversion reporting. However, the best tool depends on the goal. Microsoft Clarity is particularly useful for free heatmaps and session recordings, while Matomo, Plausible, and Fathom appeal to users with stronger privacy or simplicity priorities.
What is the best free website analytics tool?
Google Analytics 4 is a strong free option for comprehensive website measurement. Microsoft Clarity is also free and focuses more heavily on behavior analytics such as heatmaps and session recordings. Many websites can benefit from using the two together.
Is Microsoft Clarity better than Google Analytics?
Neither is universally better because they focus on different tasks. GA4 is stronger for acquisition, events, and conversion reporting. Clarity is stronger for visually examining visitor behavior through heatmaps and session recordings.
What is the easiest Google Analytics alternative?
Plausible and Fathom are designed around simpler analytics experiences and may feel easier to navigate than GA4. The right alternative depends on the level of reporting, privacy approach, and budget you require.
Which analytics tool is best for privacy?
Matomo, Plausible, and Fathom are commonly evaluated by website owners who prioritize privacy. They take different approaches, so the right choice depends on factors such as hosting, data control, required features, and applicable privacy obligations.
Do I need Google Analytics if I use Search Console?
They provide different information. Search Console focuses on performance in Google Search, while analytics platforms help measure activity associated with visits to your website. Using both can provide a more complete view of search and on-site performance.
Do website analytics tools help SEO?
They can support SEO decisions by showing how visitors interact with pages and which traffic sources or content generate meaningful activity. However, installing analytics software does not directly improve rankings. Its value comes from using the information to make better decisions.
Should a Small Blog Use GA4 and Microsoft Clarity?
It can be a useful combination. GA4 provides detailed traffic and event reporting, while Clarity adds heatmaps and session recordings. A very small blog that wants only basic statistics may prefer a simpler analytics setup instead.
Final Verdict: Which Website Analytics Tool Is Best?
After comparing the leading website analytics tools, the most important conclusion is that the best analytics tool depends on the question you need to answer.
Google Analytics 4 is the strongest overall starting point for detailed traffic, acquisition, event, and conversion reporting.
Microsoft Clarity is an excellent companion when you want free heatmaps, recordings, and visual behavior insights.
Hotjar makes more sense when UX research and direct visitor feedback are important.
Matomo stands out for organizations seeking greater control over their analytics environment and data.
Plausible Analytics and Fathom Analytics are attractive when simplicity and privacy are higher priorities than extensive reporting complexity.
Clicky remains worth considering for website owners who particularly value straightforward real-time monitoring.
For a typical blogger or small content website starting from scratch, GA4 + Microsoft Clarity is a practical combination because it provides two different perspectives without requiring a standard paid analytics subscription.
But do not install seven analytics platforms simply because seven appear in this comparison. Choose the smallest set of tools that answers the questions that actually matter to your website, configure them correctly, and use the resulting data to make measurable improvements.